13 Comments

Guest *Quan Li* @ 2017-07-13 17:14:12 originally posted:
Thank you for this great package. I have a quick question. I have output from a .Rnw file that has the R code and output color coded. I need to remove the color coding and I applied the "highlight=FALSE" option. This turned off the color coding, but it somehow also changes the spacing in the output in a random way: sometimes, the spacing is there; other times, the spacing disappears between the output and the code. Is there a way to turn-off color coding but keep the spacing?
 yihui 2022-12-17 01:26:02
I'm afraid this is a little hard. I don't have time to help you for now, so I recommend you to ask questions on StackOverflow or TeX.StackExchange instead (with a minimal reproducible example and screenshots).
Originally posted on 2017-07-19 05:04:38
Guest *Frishta Abdul Wali* @ 2017-08-15 19:19:30 originally posted:
Hi I was wondering if you have ever had .gif in knitr which would be compiled into a pdf with an animated gif. Is that even something possible?
yihui 2022-12-17 01:26:03I don't think PDF supports GIF. The only thing I'm aware of is the LaTeX package animate: https://ctan.org/pkg/animate It only works in Adobe Reader.
Originally posted on 2017-08-16 22:13:54
Guest *Karl Wolters* @ 2018-05-13 12:16:30 originally posted:
Dear Yihui Xie,
is it also possible to use knitr in Atom or maybe Jupyter Notebooks? Would be awesome if it comes for Atom. Because I have a perfect workflow in Atom for my type of work but to knit documents I find myself opening Rstudio just for that....
Thanks so much for your awesome work. This is ... amazing.
yihui 2022-12-17 01:26:03You can call knitr from command line (via Rscript), so any editor/environment that supports calling external commands can call knitr, too. See some examples at https://yihui.name/knitr/demo/editors/ I bet someone must have implemented an Atom plugin for knitr. I don't use Atom, so I'm not really sure.
Originally posted on 2018-05-13 13:45:57
Guest *M Curcio* @ 2019-06-02 23:57:18 originally posted:
Greetings,
While using Bookdown, Is it possible to generate a very large plot (for example: 10 inches wide X 7.5 inches high) then have it displayed portrait (rotate 90 degrees) style on a page?
Thanks
Guest *Olivier Renault* @ 2019-10-01 20:30:15 originally posted:
Yihui Xie,
Thank you for all the work you have done for the research, the teachers and students in statistics.
Thanks again,
best regards
yihui 2022-12-17 01:26:04Thanks for the kind words! :)
Originally posted on 2019-10-01 21:08:04
Guest *Marcelo* @ 2020-11-12 21:50:44 originally posted:
Hi! is there a way to use python chuncks with parameters like r chunks? I need to use include, warnings and echo with python chunks but i am failing to do so. Thanks!
Guest *Dante* @ 2021-01-19 14:19:09 originally posted:
Hello,
Great Articles I have learned so much about both knitr & Sweave!
I have an issue with my code right now that is using LaTeX & Sweave at the same time.
I have a main file that takes in 6 other files using SweaveInput{}.
The only problem is every time I go to execute it, the output states:
Execution haulted.
All connections are in use.
I have tried to close the connections using CloseAllConnections(), but this also throws a different error. I am at the end of my rope, I am not sure where to go from here. PLEASE HELP!
Thank you,
-Dante
Guest *madava masaba* @ 2022-05-30 10:35:09 originally posted:
The output in my html or even pdf after i have knitted or rendered is very different compared to the outputs in my R markdown before knitting. Someone help me to solve this situation.
Guest *madava masaba* @ 2022-05-30 10:35:49 originally posted:
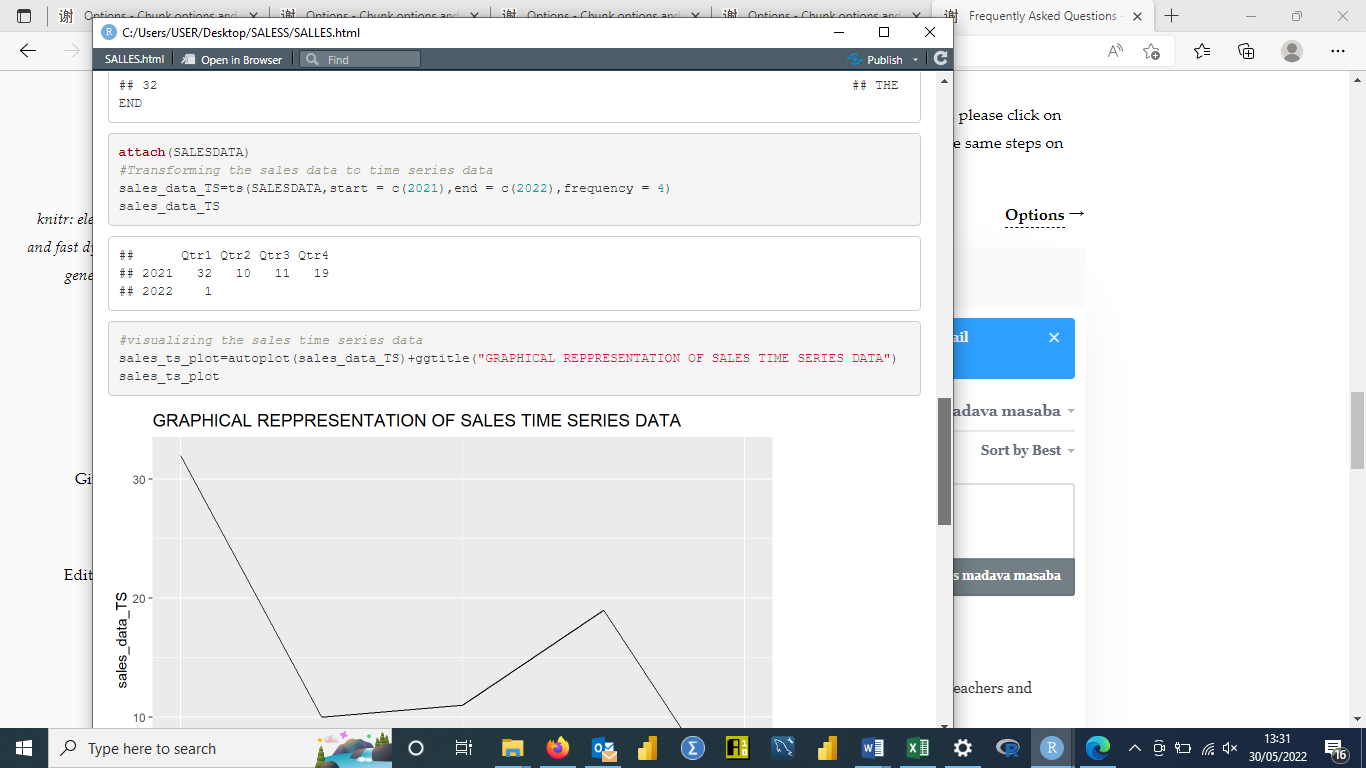

Dear Sir,
How to resolve the following errors when compiling R Notebook into a document?
All the required packages are successfully loaded, still the issue persists. Kindly help ASAP.
CODE:
# pipe operator
x<-5:15
mean(x)
x%>%mean

sum(z,na.rm=TRUE)
z%>%sum(na.rm=TRUE)

sum(is.na(z))
z%>%is.na%>%sum

mean(is.na(z))
z%>%is.na%>%mean
OUTPUT:
|...................................                 |  67% (unnamed-chunk-1)

processing file: qwerty.Rmd
Quitting from lines 13-124 (qwerty.Rmd)
Error in x %>% mean : could not find function "%>%"
Calls: <Anonymous> ... withVisible -> eval_with_user_handlers -> eval -> eval

Execution halted
CODE:
data(diamonds)
View(diamonds)

# base histogram(s)
hist(x=diamonds$carat,main="FREQUENCY vs. CARAT",xlab="carat",ylab="frequency")

# base scatter plot(s)
(plot(x=diamonds$carat,y=diamonds$price,xlab="carat",ylab="price"))
OUTPUT:
 |...................................                 |  67% (unnamed-chunk-1)

processing file: qwerty.Rmd

Quitting from lines 13-24 (qwerty.Rmd)
Error in as.data.frame(x) : object 'diamonds' not found
Calls: <Anonymous> ... eval_with_user_handlers -> eval -> eval -> View -> as.data.frame
Execution halted

感谢大神...
是从阿德莱德大学网站里 摸过来的
祝顺利
yihui 2024-09-17 01:38:15谢谢!你在奥克兰?我上周刚去了一趟奥克兰,前天刚回来。
阿德莱德是在澳大利亚 哈哈
…On Tue, 17 Sept 2024 at 11:08, Yihui Xie ***@***.***> wrote:
谢谢!你在奥克兰?我上周刚去了一趟奥克兰,前天刚回来。
—
Reply to this email directly, view it on GitHub
<#945 (reply in thread)>,
or unsubscribe
<https://github.com/notifications/unsubscribe-auth/BJIZURSTQTMSEQXFPX7R6C3ZW6BZ3AVCNFSM6AAAAABOKL7SUWVHI2DSMVQWIX3LMV43URDJONRXK43TNFXW4Q3PNVWWK3TUHMYTANRWGUZTOOI>
.
You are receiving this because you commented.Message ID: <yihui/yihui.
***@***.***>
--
Feng Zhang (William)
IT Graduate
M.ICT (University of Tasmania)
Adelaide. Australia
M:0466689999
yihui 2024-09-17 03:01:57嗯,我知道阿德莱德在澳大利亚,但你的用户名里有 UOA,所以我猜你可能是奥克兰大学毕业的。
haha UOA 就是 University of Adelaide 我才开始读 第二学期
…On Tue, 17 Sept 2024 at 12:32, Yihui Xie ***@***.***> wrote:
嗯,我知道阿德莱德在澳大利亚,但你的用户名里有 UOA,所以我猜你可能是奥克兰大学毕业的。
—
Reply to this email directly, view it on GitHub
<#945 (reply in thread)>,
or unsubscribe
<https://github.com/notifications/unsubscribe-auth/BJIZURUOGYA4HICQYDBZABLZW6LTVAVCNFSM6AAAAABOKL7SUWVHI2DSMVQWIX3LMV43URDJONRXK43TNFXW4Q3PNVWWK3TUHMYTANRWGU3TGOA>
.
You are receiving this because you commented.Message ID: <yihui/yihui.
***@***.***>
--
Feng Zhang (William)
IT Graduate
M.ICT (University of Tasmania)
Adelaide. Australia
M:0466689999
yihui 2024-09-17 04:47:02嗦嘎。
Sign in to join the discussion
Sign in with GitHub