86 Comments
Guest *MartinInFfm* @ 2012-03-23 11:13:32 originally posted:
When I use xtable in a chunk, I get a grey shaded empty line.
What can I do to suppress it?
I have tried already the options : warning=FALSE,message=FALSE,error=FALSE
Example:
<<print,echo=false,results='asis',warning=false,message=false,error=false>>=
print(xtable(data.frame(x=1)))
@
 yihui 2022-12-16 21:43:14
Can you try the latest version (0.4)? I do not see the line with 0.4.
Originally posted on 2012-03-24 05:31:26
 giscus-bot 2022-12-16 21:43:15
Guest *MartinInFrankfurt* @ 2012-03-24 08:04:37 originally posted:
It is gone now.
Thank you, Yihui!
Guest *Bastien Ferland-raymond* @ 2012-04-03 17:26:32 originally posted:
Hello Yihui,
First, thanks a lot for your work, this package is great!
I have a problem adding a figure using the layout() function and was wondering if you could help me.
An exemple code:
<<virees, results="hide" ,echo="F,fig=T,dev="png",dpi=150,fig.height=6,fig.width=10,fig.keep="high"," fig.align="center" ,fig.height="6,fig.width=10">>=
for(i in c("g4564", "g4167")){
windows(10,6)
layout(matrix(c(1,2),1,2), widths=lcm(c(25.4-15.24,15.24)), heights=lcm(c(15.24,15.24)))
par(mar=c(0,0,0,0))
plot(1,1); text(1.1,1,i)
plot(2,1, col="red"); text(2.1,1,i)
dev.off()
}
If I use that, my figures include only the left plot in the layout. Any idea why?
I actually want to print in a report with multiple figures (~250) where each one is the result of a special layout format.
Thanks a lot
Bastien
yihui 2022-12-16 21:43:16You almost never need to open and close a graphical device in a code chunk, so please remove windows(10,6) and dev.off(); knitr will open its device to record your plots, but if you have opened another device, knitr will be unable to know new plots produced.
Originally posted on 2012-04-03 21:45:42
giscus-bot 2022-12-16 21:43:16Guest *Bastien Ferland-raymond* @ 2012-04-04 12:10:46 originally posted:
Thanks for your reply,
The reason I've put windows(10,6) is because that is the only way I've found it would make the require graph. if I do not put that there, I get and error in R "Error in plot.new() : figure region too large" which then print in my pdf file. It's like if putting fig.height=6 and fig.width=10 doesn't make a device of those dimension but instead uses the system options("device").
Using windows(10,6) without the loop works (so making only one figure).
Using windows(10,6) with the loop (or I also tried with sapply()) doesn't print the full graphics
Not using windows(10,6) doesn't print anything because of device size issues.
Any idea?
Bastien
yihui 2022-12-16 21:43:17If you are using the latest version of knitr and running it under non-interactive mode (e.g. call Rscript), this should not be a problem; knitr will use fig.width and fig.height to open options('device').
If you are in an interactive R session (open R and type code), this might be problematic. It is easy to fix either on my side, though. You can also fix this by yourself by putting something like this in your first chunk:
options(device = function(...) {
  windows(..., width = opts_current$get('fig.width'),
          height = opts_current$get('fig.height'))
})
However, I still recommend you to call R non-interactively.
Originally posted on 2012-04-04 17:29:57
giscus-bot 2022-12-16 21:43:18Guest *Bastien Ferland-raymond* @ 2012-04-04 19:01:07 originally posted:
Thanks again for your time, it's very appreciated.
There is either something that I don't understand, or a bug somewhere. I'll try to give you as much information as possible, it may help you figure out what the problem is.
I'm not sure I understand very well what does using R in non-interactive mode mean, but I think it's what I'm doing. I use Tinn-R to do my coding from which I send my code. I write my rnw file and I call it using:
setwd("Z:rapport latex")
knit("test1 rapport sonar.rnw")
texi2dvi("test1 rapport sonar.tex",pdf=T,texinputs = "R_HOME/share/texmf", quiet=T, clean=T)
I've downloaded your package on monday at the same time as R 2.15.0, so I guess I have the last version. I'm using win XP 32bit.
I've tried to had the code you gave me in the previous post in my first chunk. However, I got an error:
"Quitting from lines 79-81: Error in getOption("device") : node stack overflow"
Line 79-81 represent my second chuck which has the options:
<<nppt, echo="F," dev="png" ,fig="T,fig.height=4,fig.width=7," fig.cap="Nombre de placettes potentielles par tuile" ,fig.lp="placpartuile" ,out.width=".4linewidth" , ="" fig.align="center" ,fig.pos="H">>=
However, if I run the code again without changing anything, it give me the same error but for the first chunk. It's like it keeps the same options and doesn't like it.
Also, when you say: "knitr will use fig.width and fig.height to open options('device')", that is exactly the way I expect it to behave, but I douth it's doing it, on my computer at least. If the opened device was the good size, I wouldn't get a "figure region too large" error. And also, it may be unimportant, but when I run knit(), I see my figures flashing on my screen and they are all the default 7in x 7 in, and not size I've previously define (however, the final file saved are the proper size).
what do you think? Do you need more info?
thanks
Bastien
yihui 2022-12-16 21:43:19Sorry, I had a typo in the code above; dev.new() should be windows(). For interactive vs non-interactive sessions, see ?interactive in R help.
Anyway, I have fixed this problem in the development version, so you do not really need to do anything but install the latest version from Github: https://github.com/yihui/knitr (or wait for my next CRAN release). Thanks!
Originally posted on 2012-04-04 22:40:51
giscus-bot 2022-12-16 21:43:20Guest *Bastien Ferland-raymond* @ 2012-04-05 14:56:03 originally posted:
Great! I'll wait for the cran release and let you know if I run into more trouble.
Thanks a lot,
Bastien
Guest *Morales* @ 2012-04-08 08:21:02 originally posted:
Hi Yihui, congratulations for your work with knitr. I am using it a lot, but I am having problems when I try to supress some lines in the output. It's fine when I use i.e. "echo=2", but I am not able to get "echo= 1:3" . Try this example please:
begin{document}
<<p1,echo=f,comment=na>>=
rendimiento = c(30,34,25,21,24,11,25,12,9)
metodo = factor(c(1,1,1,2,2,2,3,3,3),
labels= c("A","B","C"))
mod=aov(rendimiento~metodo)
@
<<p2,echo=1:3,comment=na,tidy=f, results="asis">>=
library(multcomp)
tuk1 = glht(mod, linfct= mcp(metodo="Tukey"))
res=summary(tuk1)
x1a=res$test$coefficients
x2a=res$test$tstat
x3a=res$test$sigma
x4a=res$test$pvalues
a1=round(data.frame(x1a,x3a,x2a,x4a),3)
colnames(a1)=c("Estimación","Std","T","P")
library(xtable)
print(xtable(a1,caption="Comparaciones: Método Tukey"),caption="top",floating=T)
@
end{document}
Guest *Morales* @ 2012-04-08 08:36:53 originally posted:
Hi Yihui,forget my previous post. I forgot the quotation marks in results= "asis" . Thanks for your fine work
yihui 2022-12-16 21:43:20Good to know. You should see a warning message about this situation when you call knit().
Originally posted on 2012-04-08 18:53:44
Guest *jamiefolson* @ 2012-05-15 14:47:45 originally posted:
What is the best practice for chunks where you only want the figures? I can turn off all of the output, but that still leaves a colored, framed box around all the chunks, even if it's just an includegraphics. I also end up with lots of stuff added to the main document header that's never used. Is there any way you could just put that stuff in a latex package and include it like framed is?
I can turn off the highlighting, but I still get the framed colorbox.
giscus-bot 2022-12-16 21:43:21Guest *Eric Nord* @ 2012-05-15 15:23:16 originally posted:
I'm trying to figure that out also.
yihui 2022-12-16 21:43:23Normally you can use echo=FALSE, results='hide' to keep the figures only. If you still find the gray box, you probably need to update the package.
For the large preamble, currently the suboptimal solution is opts_knit$set(self.contained = FALSE).
Originally posted on 2012-05-15 19:32:26
Guest *Eric Nord* @ 2012-05-15 18:01:54 originally posted:
Does anyone have nice example of using chunk options in markdown with knitr? I'm lost.
yihui 2022-12-16 21:43:22Most examples are under https://github.com/yihui/knitr/tree/master/inst/examples ; in your case, you can look at knitr-minimal.Rmd or knitr-upload.Rmd; actually these chunk options are exactly the same as the ones you write in Sweave. Instead of <>=, you just write ``` {r options}.
Originally posted on 2012-05-15 19:13:41
Guest *Florian Oswald* @ 2012-05-25 01:51:30 originally posted:
hi yihui!
I recently updated to the latest knitr version (along with R 2.15). I had a very nice (and fast) running setup with lyx before the upgrade. now knitr complains that i am using old Sweave options and I should visit this page. I'm having a hard time figuring out which options are outdated and which ones are not. Is there a kind of list for this somewhere? I guess it's slower because of this. Thanks for your help!
Florian
giscus-bot 2022-12-16 21:43:24Guest *Florian Oswald* @ 2012-05-25 01:57:42 originally posted:
wait a moment. just discovered the transitions from sweave page. need to write
results='hide'
now instead of
results=hide
that was a useless question, I guess.
see you around for more useful questions, I hope!
Florian
yihui 2022-12-16 21:43:25Glad you figured it out by yourself. All the valid option values are listed in this page, and I have emphasized in the beginning of this page that options must be valid R code.
Originally posted on 2012-05-25 02:00:37
Guest *Eugene* @ 2012-05-30 19:52:55 originally posted:
Hi Yihui,
I am running Lyx 2.0.3 on Windows XP with loaded module Knitr and have following error popping up while trying to convert R code to TeX:
"An error occurred while running>
Rscript --verbose --no-restore "C:/Program Files/LyX20/bin/../Resources/scripts/lyxknitr.R" "C:/Documents and Settings/me/Local Settings/Temp/lyx_tmpdir.Hp3588/lyx_tmpbuf2/""Paper2.Rnw""C:/Documents and Settings/me/Local Settings/Temp/lyx_tmpdir.Hp3588/lyx_tmpbuf2/""Paper2.tex" ISO-8859-15"M:/CODE/Paper2/"
"Do you have a clue what it might be?My document have an empty preamble. I only use the following options in the beginning of the document"
<<set-options, include="FALSE," echo="FALSE," cache="FALSE">>=options(replace.assign=TRUE,width=90)knit_hooks$set(par=function(before, options, envir){if (before) par(mar=c(4,4,.1,.1),cex.lab=.95,cex.axis=.9,mgp=c(2,.7,0),tcl=-.3)})read_chunk('Paper2.R')opts_chunk$set(fig.path='figure/', cache.path='cache/', dev='tikz', external=TRUE, fig.width=7, fig.height=4, fig.align='center', fig.show='hold',cache=FALSE, par=TRUE) at "
If i run the document with R chunks without bold options, it seems to work, although output needs aligning and sizing.
In R i have loaded both knitr and tikzDevice packages. I wrote "at" instead of a symbol only here due to mail autocompletion...
Best regards,
Eugene
giscus-bot 2022-12-16 21:43:26Guest *Eugene* @ 2012-06-01 07:46:52 originally posted:
I realized that bold text disappeared and lines are merged. I meant opts_chunk$set()
giscus-bot 2022-12-16 21:43:27Guest *Eugene* @ 2012-06-01 08:52:19 originally posted:
The LyX converts file with no problems if i change output device from tikz to png or pdf.
"opts_chunk$set(fig.path='figure/', cache.path='cache/', dev='tikz', external=TRUE, fig.width=7, fig.height=4, fig.align='center', fig.show='hold',cache=FALSE, par=TRUE) "
Why LyX 2.0.3 cannot convert R file if i select tikz device?
giscus-bot 2022-12-16 21:43:28Guest *Eugene* @ 2012-06-01 10:32:42 originally posted:
I also experience a problem with automatic update of images. They are properly updated only if content of a folder FIGURE is cleared. What can it be?
yihui 2022-12-16 21:43:29take a look at the corresponding TeX log file under figure/ to see what is wrong there; tikz requires LaTeX expertise, so if you are not familiar with the tikzDevice package, you probably should spend a couple of hours learning it.
Originally posted on 2012-06-01 20:08:25
yihui 2022-12-16 21:43:30LyX will not really update your document unless there has been a change in the TeX output; if you only update a plot, the tex code is probably not changed although the plot itself has been changed. In that case, you need to make a small change in any place of your LyX document.
Originally posted on 2012-06-01 20:12:26
Guest *Rafik Margaryan* @ 2012-07-04 07:45:13 originally posted:
Hi Yihui,
I've got confused with references and it seems does not work for me. If I put chunck label for plot fig1, how shoud referre to that figure by default : fig:fig1 or just fig1?
And how should I refer to tables( I use Hmisc summary.formula for creating tables)?
Many thanks
yihui 2022-12-16 21:43:32Because fig.lp is 'fig:' by default, you need to ref{fig:fig1} instead of ref{fig1}. If you want the latter, you can set opts_chunk$set(fig.lp = '') so that no prefix will be added by knitr.
Originally posted on 2012-07-04 20:55:14
Guest *Chris Okugami* @ 2012-07-09 20:48:45 originally posted:
Hi, Yihui,
I got a problem using kintr and markdown on ubuntu. x64
here is my markdown code.
mytest.Rmd
this code generates animation buttons but it doesn't play on web browser.
{r echo=FALSE,fig.path='figure/fig2',fig.keep='all',[fig.show](http://fig.show)='animate'} plot(rnorm(100))plot(rnorm(100))
yes, i have mp4 support on ubuntu, with internet connection.
Any idea?
yihui 2022-12-16 21:43:33I have heard other users report the same problem under Ubuntu, and I do not know why it does not work for you. I'm using Ubuntu as well.
There was indeed a small bug before v0.6.3, just in case you were using an older version.
Originally posted on 2012-07-10 01:12:27
giscus-bot 2022-12-16 21:43:35Guest *Chris Okugami* @ 2012-07-10 01:24:36 originally posted:
FYI:
I am using v0.6.3 knitr version.
yihui 2022-12-16 21:43:36You probably need par(bg='white') if you are using base R graphics; I just found that FFmpeg did not work with PNG's with transparent background.
Originally posted on 2012-07-10 16:07:13
giscus-bot 2022-12-16 21:43:39Guest *Chris Okugami* @ 2012-07-11 23:59:28 originally posted:
Thanks, Yihui,
par(bg='white') did produced a proper video mp4 file, however, when I try to view the generated context, failed to load on the browser. I've check my web browser ensure of html5 video on my chrome and firefox, seems to be ok - facebook works so. my suspision is the type of mp4 video codec, which is not common to most of all computing environment. What do you think?
yihui 2022-12-16 21:43:40MP4 should be very common nowadays. I have no idea about what is wrong. Anyway, you will soon be able to write animations into HTML pages like those in http://taiyun.github.com/
Originally posted on 2012-07-12 03:55:56
Guest *Chris Okugami* @ 2012-07-09 21:00:55 originally posted:
animation option.
Currently, support animation.fun ="hook_ffmpeg_html".
Is it possible to use animated gif as output? instead of mp4?
It will be very nice to make animated PDF from markdown so that we can space in our report!!
My motivation behind this is that
I work with large dataset, many sampling points, very tiring of scrolling down!!
Thank for your help
Chris
yihui 2022-12-16 21:43:34It is almost impossible to convert animations in HTML to PDF, because they were drastically different in this aspect. That being said, you can create either LaTeX/PDF animations or HTML animations with the same code and syntax (fig.show='animate'), so you'd better do that from the source rather than generating markdown and convert the animations to PDF later.
It is certainly possible to do GIF. Just file a feature request to https://github.com/yihui/knitr/issues
In the development version of knitr, you can already make animations with JavaScript (hook_scianimator) or Flash (hook_r2swf), but no instructions have been given. We are working on it. Hopefully you will see some interesting announcements next week.
Originally posted on 2012-07-10 01:19:47
Guest *Donlumor* @ 2012-07-10 08:32:49 originally posted:
senic ¡- read.table(”pdata.txt”, header = FALSE) colnames(senic) ¡- c(”y”, ”x1”, ”x2”, ”x3”, ”x4”,
”x5”, ”x6”, ”x7”, ”x8”, ”x9”, ”x10”) attach(senic) pairs(senic, pch = 21, bg = c(”red”, ”yellow”, ”blue”,)
I used this code for the above result
<<echo=true,fig=true,comment="", eval="TRUE">>=senic<-read.table("pdata.txt",header=FALSE)colnames(senic) <- c("y","x1","x2","x3","x4","x5","x6","x7","x8","x9","x10")attach(senic)pairs(senic, pch=21, bg=c("red","yellow","blue","black"))
My output does not execute line by line
I used <- to store read .table but i get ¡- in output
I use Rstudio for my reports
yihui 2022-12-16 21:43:35I do not understand your question. I need a reproducible example along with your sessionInfo() after library(knitr).
BTW, fig=TRUE has been deprecated long time ago; you do not need fig=TRUE in knitr.
Originally posted on 2012-07-10 16:05:54
giscus-bot 2022-12-16 21:43:37Guest *Donlumor* @ 2012-07-10 16:52:57 originally posted:
documentclass{article}author{Richard LumorSTAT 482: REGRESSION ANALYSIS}title{MODELLING THE AVERAGE LENGTH OF STAY IN A HOSPITAL USING SENIC DATA}usepackage{amsmath}usepackage{setspace}usepackage{multirow}usepackage{graphicx}usepackage{times}usepackage{float}usepackage{verbatim}usepackage{geometry}begin{document}SweaveOpts{concordance=TRUE}maketitlesection{Introduction}We are going to do an exploratory analysis of the SENIC hospital data. We will use both qualitative and quantitative techniques.<<echo=true,comment="">>=senic<-read.table("pdata.txt",header=FALSE)colnames(senic) <- c("y","x1","x2","x3","x4","x5","x6","x7","x8","x9","x10")attach(senic)pairs(senic, pch=21, bg=c("red","yellow","blue","black")) @the plot shows correlation between
library(knitr)
sessionInfo()
library(knitr)> sessionInfo()R version 2.15.1 (2012-06-22)Platform: x86_64-pc-mingw32/x64 (64-bit)locale:[1] LC_COLLATE=English_United States.1252 LC_CTYPE=English_United States.1252 [3] LC_MONETARY=English_United States.1252 LC_NUMERIC=C [5] LC_TIME=English_United States.1252 attached base packages:[1] stats graphics grDevices utils datasets methods base other attached packages:[1] knitr_0.6.3loaded via a namespace (and not attached):[1] digest_0.5.2 evaluate_0.4.2 formatR_0.5 plyr_1.7.1 stringr_0.6 [6] tools_2.15.1
yihui 2022-12-16 21:43:38Oh, this is not an appropriate place to paste the code. I can barely read it. Could you please file an issue to https://github.com/yihui/knitr/issues ? Thanks! And I doubt if the above example is reproducible for me, because I do not have pdata.txt
Originally posted on 2012-07-10 20:20:23
Guest *Sebastian Campbell* @ 2012-07-13 04:49:10 originally posted:
testfun.Rmd:
summary(cars)
I'm not sure if this is a bug (and it doesn't cause knitting a document to stop), but this causes and error:
options(encoding=''); require(knitr); knit('testdash.Rmd');
Loading required package: knitr
processing file: testdash.Rmd
Error in parse(text = str_c("alist(", params, ")")) :
1:20: unexpected ','
1: alist( car-function,
^
Warning in parse_params(params) :
(*) NOTE: I saw options " car-function, eval=FALSE"
are you using the old Sweave syntax? go http://yihui.name/knitr/options
yihui 2022-12-16 21:43:40I did not mention this in the documentation. Strictly speaking, chunk labels must be quoted as well because they are character strings. In most cases they do not need to be quoted because they are valid R expressions if not being quoted, e.g. a-b, or c_def. However, in your case car-function is not a valid R expression, because "function" is a reserved keyword in R. I will add an explanation to this page later. Thanks for the report!
Originally posted on 2012-07-13 17:26:35
Guest *Gurix* @ 2012-07-17 16:49:01 originally posted:
Good work bro. That's indeed a significant step forward in R history.
Guest *wegelinjacob* @ 2012-07-18 19:45:13 originally posted:
At http://jacobwegelin.net/tmp/XieYihui/, in the
20120718Wed151045-foo.Rhtml example, I specified "echo=FALSE" to try to show only the results. But when the resulting html file (also on the website) is displayed in a browser, a bunch of pound or number signs (#) are displayed in place of the R source code. Is there a clean automatic way to get rid of all traces of the R code in the displayed html, so that one only sees (in this case) the displayed table?
The pertinent documentation (from http://yihui.name/knitr/options) is:
echo: (TRUE; logical or numeric) whether to include R source code in the output file
In the same place a 2nd html file can be found which contains the lines from the prevous html that are necessary to display the table, without the preamble that starts the first html file. What is the function of those pound signs?
yihui 2022-12-16 21:43:41use results='asis'; because you are writing raw HTML from R
Originally posted on 2012-07-18 20:51:52
Guest *wegelinjacob* @ 2012-07-18 20:37:25 originally posted:
knitr issues a warning about my chunk options, accusing me of Sweave thinking, when (as far as I can tell) I am using the very options specified in this page, http://yihui.name/knitr/options. What am I missing?
See "20120718Wed163809-knit01.Rnw.txt example" on the following page:
http://jacobwegelin.net/tmp/XieYihui/
knitr says
Warning in parse_params(params) :
(*) NOTE: I saw options "echo=TRUE, results=asis"
are you using the old Sweave syntax? go http://yihui.name/knitr/options
See the url above for the details and a reproducible example.
yihui 2022-12-16 21:43:42can you finish reading all the 3 bullet points in the beginning of this page?
btw, if you update knitr to v0.7 (which is already on CRAN now), you will see a more detailed note about the reason of the failure
Originally posted on 2012-07-18 20:53:36
giscus-bot 2022-12-16 21:43:43Guest *wegelinjacob* @ 2012-07-18 21:26:59 originally posted:
I see two bullet points at the beginning of the page: chunk options and package options. What three bullet points do you refer to?
giscus-bot 2022-12-16 21:43:44Guest *wegelinjacob* @ 2012-07-18 21:31:06 originally posted:
I tried updating using install.packages("knitr") and using the GUI packages updater in R, and got the following error:
Try updating
trying URL 'http://lib.stat.cmu.edu/R/CRAN/bin/macosx/leopard/contrib/2.15/knitr_0.6.3.tgz'
Error in download.file(url, destfile, method, mode = "wb", ...) :
cannot open URL 'http://lib.stat.cmu.edu/R/CRAN/bin/macosx/leopard/contrib/2.15/knitr_0.6.3.tgz'
In addition: Warning message:
In download.file(url, destfile, method, mode = "wb", ...) :
cannot open: HTTP status was '404 Not Found'
Warning in download.packages(pkgs, destdir = tmpd, available = available, :
download of package ‘knitr’ failed
yihui 2022-12-16 21:43:45I do not know why you failed or why your R chose knitr 0.6.3, since the one on CRAN should be v0.7: http://lib.stat.cmu.edu/R/CRAN/web/packages/knitr/index.html
Originally posted on 2012-07-18 23:55:34
yihui 2022-12-16 21:43:46Sigh... Could you just scroll down a little bit?
Originally posted on 2012-07-18 23:58:48
Guest *wegelinjacob* @ 2012-07-18 21:24:59 originally posted:
I have tried to convert a *.Rnw which works in Sweave, into knitr. Using Sweave and xtable, I can display a table in a pretty format within a LaTeX-created pdf. You can find a link to the Sweave success, and my attempt to make this work in knitr, at http://jacobwegelin.net/tmp/XieYihui/ under "20120718Wed171457 example."
If I'm reading the knitr options correctly on this page, to convert to knitr one must eliminate chunk header such as "results=tex" and replace it with something like "results=asis" or "results=markup". But I'm running into two problems. (1) Even with the above change in header specification, knitr still issues a warning.(2) The table does not display in the pdf file as a proper table. See http://jacobwegelin.net/tmp/XieYihui/ for details.
Thanks for any insights.
Jake
giscus-bot 2022-12-16 21:43:44Guest *wegelinjacob* @ 2012-07-18 22:45:18 originally posted:
I got this to work. See http://jacobwegelin.net/prn/20120718Wed183538/.
giscus-bot 2022-12-16 21:43:47Guest *wegelinjacob* @ 2012-07-19 18:41:02 originally posted:
One tricky thing is that one must say
results='asis'
with the single quotes around the value 'asis'. I think this is what Yihui meant when he stated that I must search through the bullet points on this web page.
Another point is the difference in effect between the 'asis' and 'markup' options.
Examples are at http://jacobwegelin.net/prn/20120719Thu114541/.
yihui 2022-12-16 21:43:48That is not tricky. There is nothing to remember. The rule is simple: make sure whatever you write is valid to R; results=asis is not valid because there is no object named "asis". Just think about the difference between function(results=asis) and function(results="asis"). I recommend you to stop spending so much time experimenting by yourself. I have documented this clearly in this page -- read everything from the top up to the line "All built-in options in knitr are:".
Originally posted on 2012-07-19 21:03:35
Guest *Gary4IR* @ 2012-07-26 04:49:31 originally posted:
Yi Hui, Thanks for your great contribution to the UseR community with this package. I am new to LaTeX and LyX. I have built a substantial report using R and LyX with knitr, and I love the way it looks. There is one thing I'm stuck on, however. One page of the report has a wide table taking up the top half of the landscape document, and another smaller table takes up less than half of the bottom half of the page. I want to have a ggplot2 graphic appear in the lower right hand corner using a chunk, but no matter what I try, I can't keep it from bumping down to the next page. Is there a way to force an image created in a chunk to appear adjacent to a table? Thanks for any help you can offer.
-Gary
giscus-bot 2022-12-16 21:43:49Guest *Gary4IR* @ 2012-07-26 21:38:24 originally posted:
Solved! I created a 2x2 table, put the top wide table one in merged columns on top, the small one in the lower left cell, and my chunk in a Box(Minipage) in the lower right cell - Everything works just fine. I was initially using a document class that didn't allow this configuration, which was very confusing for a while.
-Gary
yihui 2022-12-16 21:43:50Glad to know you figured it out by yourself :)
Originally posted on 2012-07-26 23:27:44
Guest *HLM* @ 2012-07-26 11:44:18 originally posted:
Hi YiHui,
Thanks again for creating knitr its amazing!
Is there a way to set the chunk options (and specifically fig.width and fig.height) mid chunk?Also is there an issue about plotitng the same graph in the same chunk. e.g. I would expect two very different size graphs to appear when running the following:
{r}opts_chunk$set(fig.width=3)plot(1:1000)opts_chunk$set(fig.width=10)plot(1:1000)
the image attached is what I got
yihui 2022-12-16 21:43:50Sorry I just noticed the comment was sent to the moderation queue. But apparently there are more people to help you on SO :) http://stackoverflow.com/q/11668904/559676
Originally posted on 2012-07-27 19:58:19
Guest *Gary4IR* @ 2012-07-30 19:14:26 originally posted:
How does one turn off all caching? I'm stuck on this despite reading the section on Cache in the user's guide.
For example, I'd like the following chunk to return a different value each time:
<<ch1,echo=false>>=
rnorm(1, 6, 1.1)
@
Feel free to yell at me - I know this must be very basic.
-Gary
yihui 2022-12-16 21:43:51I saw the same question on SO: http://stackoverflow.com/q/11782037/559676
This is pretty weird, and I do not know how this can happen without set.seed(). Anyway, please try to clean up the cache directory or start with a minimal example to diagnose the problem.
One possibility is that you have a chunk which was cached and involved with random number generation before this chunk, so that when this chunk is evaluated, the random seed from that chunk is used. If that is the case, it is not a basic question. It is actually very deep.
Originally posted on 2012-08-04 23:44:31
giscus-bot 2022-12-16 21:43:56Guest *Garyrmoser* @ 2012-08-16 21:58:25 originally posted:
Thanks for helping me think through it. I discovered that I had a set.seed() command in my .Rprofile file, and when I removed it, I started getting expected results via LyX + knitr. I didn't understand why at first, but now I see it's because a new instance is created at each document creation, and that set.seed() determines the output. It fooled me because it doesn't have that effect in a typical R session. Thanks!
访客 *97m423* @ 2012-08-13 13:50:47 写道:
Hi 谢大侠,
using caption[Example]{blahblahblah} in LaTeX allows two different captions of a graphic, [Example] will be showed in List of Figures and {blahblahblah} will be showed directly as caption under the graphic. How could I use this []{} in fig.cap in knitr?Best regard,Schorschi
giscus-bot 2022-12-16 21:43:52Guest *97m423* @ 2012-08-13 13:52:14 originally posted:
Omg I'm so retarded, scap...
yihui 2022-12-16 21:43:53yes, use fig.scap='Example'
Originally posted on 2012-08-13 16:31:50
giscus-bot 2022-12-16 21:43:54Guest *97m423* @ 2012-08-14 10:11:59 originally posted:
yeah, sry about that dummy question, this time I really tried to read the options over but still have no clue about how could I write LaTeX in caption, since the type of fig.cap ist 'character', textit{abc} won't work, right?
yihui 2022-12-16 21:43:55Use fig.cap='textit{abc}'; character options should be quoted, as mentioned in the top of this page.
Originally posted on 2012-08-15 14:56:26
Guest *Akshay* @ 2012-08-26 20:27:28 originally posted:
Hi,
I am trying to input a yacas expression in a knitr file.
The output of this
{r }fmt <- sprintf("TeXForm(%s)", cost)yacas(fmt, retclass = "unquote")
is a latex expression as follows :
$ mu + frac{2 lambda }{mu - lambda } $
But I'd like knitr to understand that it is a latex statement and write it in latex form ( as it would do if I had written seperately : $$ mu + frac{2 lambda }{mu - lambda } $$
Any ideas? Thx!
yihui 2022-12-16 21:43:56See comments below your SO post: http://stackoverflow.com/q/12133526/559676
Originally posted on 2012-08-26 21:48:22
giscus-bot 2022-12-16 21:43:57Guest *Akshay* @ 2012-08-26 22:36:37 originally posted:
Thanks Yihui! But it did not work.. I replied to the post...
Guest *Donelle* @ 2012-09-13 02:45:28 originally posted:
I am trying to use R to do some matrix calculations and then display
using Latex, I cannot seem to find any help online that tells me how I
would go about doing this. I briefly looked at Xtable, but it does not
perform to the specifications I need. Please let me know if there
currently is an option.
giscus-bot 2022-12-16 21:43:58Guest *Mark80305* @ 2012-09-14 01:41:49 originally posted:
Hi,
Did you look at the xtable documentation? It give many examples.
What are your specifications?
Guest *Mark80305* @ 2012-09-13 22:04:31 originally posted:
Thanks again for this wonderful package.
How do I change the default font size for my tikz plots?
yihui 2022-12-16 21:43:59I do not know how to set the default font size for base graphics, but in ggplot2 you can set the theme to use a base font size. BTW, the font size also depends on whether you change the size of the whole figure in LaTeX.
Originally posted on 2012-09-14 03:47:26
giscus-bot 2022-12-16 21:44:00Guest *Mark80305* @ 2012-09-14 15:27:37 originally posted:
Thanks - I found another work-around, too:
you can set 'split=TRUE' in the SweaveOpts -
This makes the font size (for all tikz plots) the same as the document font size (which is what I was really after)
And it also integrates the document fonts into the plot fonts -- useful if, for example, you want oldstyle numbers in your document text AND plot annotations (don't forget usepackage{oldstyle, hfoldsty} in the preamble of your Rnw document).
Cheers!
Mark
yihui 2022-12-16 21:44:01but split=TRUE is not supposed to have any effects in the font size; it only splits the tex code of an R code chunk into a separate file; if split=TRUE works, split=FALSE (default) should be the same.
Originally posted on 2012-09-15 03:27:43
Guest *wellermatt* @ 2012-10-17 23:20:54 originally posted:
I can't stress enough how good this package is. It really is magnificant. Dumping my analysis to an HTML page is so simple, shame the same cannot be said for the LaTex creation, but that's due to the steep learning curve with that form of output rather than limitations of knitr.
I have a specific question regarding the sizing of plots. I have a routine which generates 120 plots in a list [1..30] of lists [1..4] for later output. I wish to be able to dump these out, but apply some resizing depending on which plot I am outputting.
print(x)
Currently every plot is outputted within a single code chunk using a single height x width, but I need the flexibility for every 4th plot to be much smaller. So the question is whether I can set the size parameters WITHIN the chunk. I really want to avoid having to write 60 chunks of code, such as:
print(x[[1]][[1:3]])
print(x[[1]][[4]])
etc for element of the outer loop.
My apologies for not explaining myself extremely clearly here but I hope I've got my question over well enough for somebody to advise. Thanks.
yihui 2022-12-16 21:44:02The description is pretty clear to me, but unfortunately there is no obvious solution. One thing that you might try is to draw the four plots in a single layout, e.g.
layout(matrix(1:4, 4), heights=c(5, 5, 5, 3))
par(mar = c(4, 4, .1, .1))
plot(rnorm(10))
plot(rnorm(10))
plot(rnorm(10))
plot(runif(10))
Originally posted on 2012-10-19 05:12:03
Guest *Feizai060* @ 2012-10-20 00:02:47 originally posted:
Hi Yihui,
It is a fantastic package, which I like so much. One problem when I want to generate animation is:
I set chunk option: fig.show='animate'. But there is no mp4 file generated in the Figure Folder. Therefore no animation displayed in the knitted html. Any help or suggestion? Thanks.
Best,
yihui 2022-12-16 21:44:03Let's focus on the SO post: http://stackoverflow.com/q/12983930/559676
Originally posted on 2012-10-20 01:47:31
Guest *Guangyu Zhu* @ 2012-10-29 16:12:48 originally posted:
Hi Yihui,
This is a great package. It helps me a lot in writing notes.
I meet a problem, I want to make the output in two columns, then I tried
usepackage{multicol}
begin{multicols}{2}
<<>>=
@
end{multicols}
but it did not work. Do you have any solution?
yihui 2022-12-16 21:44:04I do not see any problems with the latest version of knitr and TeXLive 2012. See the attached image as an example. The source document is at https://github.com/yihui/knitr-examples/blob/master/055-multicols.Rnw
Originally posted on 2012-10-29 16:42:59
giscus-bot 2022-12-16 21:44:04Guest *Guangyu Zhu* @ 2012-10-29 21:19:17 originally posted:
I know where the problem is. The output is a box, so it can only be in one column,and not atomically divide into two columns.
giscus-bot 2022-12-16 21:44:06Guest *zhgy jan* @ 2012-10-29 21:31:03 originally posted:
If I delete begin{kframe} end{kframe}, then I get what I want.
But I also lose background, do you have any other solution?
yihui 2022-12-16 21:44:06The framed package is really tricky to use: http://yihui.name/knitr/demo/framed/
In this case, I'm not aware of any solutions either. Sorry...
Originally posted on 2012-10-29 22:50:31
Guest *Matt Bannert* @ 2012-11-05 13:54:26 originally posted:
Thanks sooo much for the cairoPDF option... googlers read this: http://www.stat.auckland.ac.nz/~paul/R/PDF/pdfEncoding.html
Guest *Matt Bannert* @ 2012-11-05 14:00:12 originally posted:
afaik the cairo function is called dev='cairo_pdf', not dev='CairoPDF'. Hell of an option though. Thanks sooo much. Googlers might want to read this note by Paul Murrell, too: http://www.stat.auckland.ac.nz/~paul/R/PDF/pdfEncoding.html
yihui 2022-12-16 21:44:07Thanks! Perhaps I did not make it clear enough: cairo_pdf() is in base R (Paul's web page is a little bit outdated; Windows also has cairo_pdf now); CairoPDF is in the Cairo package, and Cairo_pdf is in cairoDevice.
Originally posted on 2012-11-05 17:50:54
giscus-bot 2022-12-16 21:44:08Guest *Matt Bannert* @ 2012-11-06 20:48:06 originally posted:
Thanks for the fast reply. In the meantime I figured it out and got knitr running with cairo. I really like the speed of this solution. Unfortunately cairo does not support CMYK afaik. The reason I used cairo instead of standard pdf device was that I had problems with unsupported UTF-8 chars (namely greater equal, less equal) for my axis labels. Long story short: I need a pdf device that supports these characters AND CMYK. Is there such a device or would you rather stick with cairo and then try to convert it to CMYK with imagemagick outside R? Would be interesting to hear your opinion...
yihui 2022-12-16 21:44:09I'm not aware of any existing solutions. None of the Cairo devices above supports CMYK. I have a hack in mind, which is to use the tikz device in the tikzDevice package. You can probably post-process the tex file generated by tikzDevice to replace the RGB colors by CMYK colors.
Originally posted on 2012-11-07 01:25:09
Guest *Akshata Udyavar* @ 2012-11-07 06:50:47 originally posted:
Hi - When I try to echo R code, it gives me a message in compile PDF such as this e.g. : "Overfull hbox (148 pt too wide) in paragraph at lines 204--204".
How do I resize the output text in the R output?
yihui 2022-12-16 21:44:10try the width option, e.g. options(width = 50)
Originally posted on 2012-11-07 20:03:57
Guest *Jesus_Gaby* @ 2012-12-02 01:25:04 originally posted:
Hi Yihui,
Below I showed you the result of using R Mardown [I select that data from database]. I dont need the ##, ##1, ##",..., ##19, and another one is the result Setúbal = Setúbal [not recognized portuguese characters like ú, é, ç, etc...] How would I solved it?
region_id name total_users
1 2735941 Porto 573
2 2742610 Aveiro 288
3 2267056 Lisboa 121
4 2740636 Coimbra 48
5 2742031 Braga 46
6 2262961 Setúbal 10
7 2732437 Vila Real 8
8 2267094 Leiria 8
9 2732264 Viseu 4
10 2593105 Madeira 4
11 2732772 Viana do Castelo 4
12 2263478 Santarém 3
13 2268337 Faro 3
14 3411865 Açores 3
15 2269513 Castelo Branco 3
16 2268404 Évora 2
17 2270984 Beja 2
18 2742026 Bragança 1
19 2738782 Guarda 1
yihui 2022-12-16 21:44:10Use the chunk option comment=NA or comment='' if you do not want ##.
For portuguese characters, it is an encoding problem. It is complicated without further information -- where do these characters come from? What was their original encoding? Which editor did you use?
Originally posted on 2012-12-02 03:11:55
Guest *Jesus_Gaby* @ 2012-12-02 03:39:56 originally posted:
I'm using RStudio. These caracters are saving on database, like in database table is Évora but when I select using SQL queries thru RPostgreSQL, return me Évora.
Are there any settings on RStudio to solve this problem?
Thanks in advance,
yihui 2022-12-16 21:44:11So what is the encoding of the database? I suppose there must be an option in RPostgresSQL, but I have never used this package before, so I'm not sure.
Ideally if everything is UTF-8, there will be much less pain.
Originally posted on 2012-12-02 04:26:33
Guest *Jesus_Gaby* @ 2012-12-02 18:32:35 originally posted:
The caracter in database is en_US.UTF-8. I see, maybe it used english US that's why didnt recognize portuguese caracter. Thanks for suggestions. Let me see how to solve it.
Thanks,
Guest *JoAnn Alvarez* @ 2012-12-11 20:07:04 originally posted:
Hi Yihui,
I noticed that if I have multiple plots within one chunk that will run over more than one page in my output file, adding a fig.cap in the chunk header will cause only the first page to display on the output document. If I leave out the fig.cap, all the plots will display on the pages. This could be problematic.
Thanks!
yihui 2022-12-16 21:44:12Are you using the latest version of knitr? Can you provide a minimal example? I do not see how this could happen:
documentclass{article}
begin{document}
<<test, fig.cap='asdf'>>=
x=rnorm(100)
plot(x)
x=rnorm(100)
plot(x)
x=rnorm(100)
plot(x)
@
end{document}
Originally posted on 2012-12-12 02:13:27
giscus-bot 2022-12-16 21:44:14Guest *JoAnn Alvarez* @ 2013-01-09 20:18:04 originally posted:
It occurs when fig.show is set to hold. I would like all the figures as condensed as possible and have the caption appear 1 time at the end. However, if they span multiple pages, only the first page displays.
documentclass{article}
begin{document}
<<>>=
opts_chunk$set(fig.show="hold")
@
<<test, fig.cap="asdf">>=
x=rnorm(100)
plot(x)
x=rnorm(100)
plot(x)
x=rnorm(100)
plot(x)
@
end{document}
yihui 2022-12-16 21:44:15By setting fig.cap, you mean to use the figure environment, which in turn means you must make sure the content of the figure environment can fit into one page, which is not true in your case. That is a LaTeX problem.
What I can suggest at most is to make your plots smaller, e.g. fig.width=3, fig.height=3
Originally posted on 2013-01-09 21:40:52
Guest *Rafik Margaryan* @ 2013-01-04 12:45:21 originally posted:
Hi Yihie,
I have to ask an advice. I write it here , because I could not find better place tho ask.
Here is a code that I have written for my personal use for article writing and it expresses mean +/- sem.
Here is the code:
m.se <- function (x, na.rm = TRUE) {
if (na.rm)
x <- x[(x)]
n <- length(x)
if (n == 0)
return(c(mean = NA, sem = NA))
xbar <- sum(x)/n
se <- sqrt(sum((x - xbar)^2)/(n - 1))/sqrt(n)
ret = c(mean = xbar, sem = se)
class(ret) ="m.se"
ret
}
print.m.se = function(x, digits = getOption("digits"),...){
print(paste(format(x["mean"],digits=digits), "pm",format(x["sem"],digits=digits)))
invisible(x)
} R output gives me "2.35 pm 0.35",
I was expecting from knitr to return with Sexpr {} like example of 2.35 pm 0.34 or so, but it returns in latex file as
2.35, 0.34 when I use Sexpr{}, "2.35 pm 0.35" when I use it inside the chunk. I have no idea how I can fix it.
Could you give some suggestion on this?
Many thanks beforehand.
yihui 2022-12-16 21:44:13A better place to ask is StackOverflow: http://stackoverflow.com/questions/tagged/r
Originally posted on 2013-01-04 18:14:20
Guest *JoAnn Alvarez* @ 2013-01-16 21:29:11 originally posted:
Is there a different default highlighting color (highlight option) for different types of chunks? I am using the framed package to highlight some latex text outside of the chunks. A side effect is that, while most of my r code has the default gray background color, the code from one chunk has blue highlighting.
yihui 2022-12-16 21:44:16You can only use different background colors for different chunks (see the background option above), but you cannot really use different highlighting themes for tokens in different chunks. You can only have one highlighting theme in one document.
Originally posted on 2013-01-17 02:22:37
Guest *Dave Matthews* @ 2013-01-18 14:02:53 originally posted:
My first attempt at Rmarkdown.
rnorm(10)
I am getting this error when I Knit HTML
Quitting from lines 28-29 (test.rmd)
Error in evaluate(code, envir = env, new_device = FALSE, stop_on_error = if (options$include) opts_knit$get("stop_on_error") else 2L) :
unused argument(s) (new_device = FALSE, stop_on_error = if (options$include) opts_knit$get("stop_on_error") else 2)
yihui 2022-12-16 21:44:16FAQ 1: http://bit.ly/knitr-faq
Originally posted on 2013-01-18 19:21:31
Guest *Carl* @ 2013-02-13 18:09:18 originally posted:
We can selectively turn on/off chunk execution with eval=TRUE and eval=FALSE within the source.
But is there a way to call knit() and select execution of chunks without changing the source?
yihui 2022-12-16 21:44:17no, but you can hack the source, e.g. gsub('^<<', '<<eval=FALSE,', ...)
Originally posted on 2013-02-13 19:13:52
Guest *guest* @ 2013-02-20 20:38:04 originally posted:
Dear Yihui, I am using Knitr to make weekly reports. I was wondering is there a way to set a test chunk in the middle of the file, so that if returned FALSE, Knitr will not run the rest of the report? Thank you !
yihui 2022-12-16 21:44:18Yes, for example, you can if (foo == FALSE) {opts_chunk$set(eval=FALSE, include=FALSE)}; then after this chunk, the global chunk options are changed so that the chunks are neither evaluated nor included in the output.
Originally posted on 2013-02-21 00:38:51
giscus-bot 2022-12-16 21:44:19Guest *guest* @ 2013-02-21 16:56:27 originally posted:
Thanks ! It works :)
Guest *JoAnn Alvarez* @ 2013-03-13 16:07:02 originally posted:
What up, Yihui. I have a question about caching. Suppose you have 2 .Rnw files in the same directory, and both of them have a chunk with the same chunk label, but the code inside is different. By default, if caching is used, there will be one cache directory that both files will try to access. Will the caching work correctly for both files?
yihui 2022-12-16 21:44:20No. The same labels in two Rnw files which are under the same directory will cause cache clash; only cache files for one chunk will survive.
Originally posted on 2013-03-14 05:59:30
giscus-bot 2022-12-16 21:44:21Guest *JoAnn Alvarez* @ 2013-03-26 21:04:38 originally posted:
Thanks, Yihui. Your answers are very helpful.
Guest *Doi* @ 2013-03-30 07:49:45 originally posted:
Hi Yihui, a command in a chunk has been printed out too long that goes beyond the margin. How can I limit the width of it?
yihui 2022-12-16 21:44:21See http://bit.ly/knitr-faq #7
Originally posted on 2013-03-30 15:53:50
giscus-bot 2022-12-16 21:44:22Guest *Doi* @ 2013-03-30 22:40:02 originally posted:
Thanks Yihui for your link. I followed the link and tried with the knitr-minimal.Rnw frame but the text still larger than the gray box, see page 2 of the pdf file.
Here are the pdf and the .Rnw files:
http://goo.gl/HK9jk
http://goo.gl/HSouN
The length of texts in the second gray box is not the same as the one you produced. What did I miss here?
yihui 2022-12-16 21:44:23Sorry for the confusion. The width option is a suggestion only. It is not strictly respected. If you want precise control over the code width, you need to use tidy=FALSE and knitr will not reformat the code.
Originally posted on 2013-03-30 23:58:09
Guest *Brett Longworth* @ 2013-04-22 20:21:36 originally posted:
Knitr seems to not embed png figures in the html output if the chunk name includes spaces (I know, bad practice). Is this a bug, or am I missing something? This is almost certainly a FAQ, but I couldn't find it mentioned. Thanks for knitr!
yihui 2022-12-16 21:44:24Sorry I cannot reproduce it. Please provide a reproducible example along with your sessionInfo().
Originally posted on 2013-04-24 09:12:18
giscus-bot 2022-12-16 21:44:25Guest *Brett Longworth* @ 2013-04-29 20:10:48 originally posted:
Maybe just a Windows thing? I was able to reproduce by naming the chunk that plots in the RStudio default R markdown template document "cars plots" Ie: change {r fig.width=7, fig.height=6} to {r cars plots, fig.width=7, fig.height=6}. What's the best way to get the code and output to you- Stackinfo? the knitr github page?
yihui 2022-12-16 21:44:26Either StackOverflow or Github issues will be OK; the latter is preferred, though. Thanks!
Originally posted on 2013-05-25 07:05:31
Guest *Harold C.* @ 2013-05-25 11:38:27 originally posted:
Excellent work, you have made my computing life much easier, thank you! I am also reporting an error in documentation: „highlight: (TRUE; character)“ should be logical.
yihui 2022-12-16 21:44:26I'll fix it. Thanks!
Originally posted on 2013-05-27 01:14:36
Guest *Shima* @ 2013-05-30 12:02:26 originally posted:
Hello Yihui,
How can I change the font size of the values in my table to prevent it to exceed from the margin?
I used "size=footnotesize" but it does not work.
<<make the="" table,="" echo="F,tidy=TRUE," results="markup" ,="" size="footnotesize">>=
library(psych)
Duration_TimeByRoute<-describeBy(CopReadingDataFrame$Duration_Time,
CopReadingDataFrame$Route, mat =
TRUE)[,c("group1","n","mean","sd","min","median","max")]
@
<<print table,="" echo="F," tidy="TRUE" ,results="asis" ,="" size="footnotesize">>=
xtable(as.matrix(Duration_TimeByRoute), floating=FALSE)
@
It seems also that the ”floating=FALSE” does not work either.
I have another question,
Is there any way to prevent running all the R codes when I only change one chunk option?
Thanks for your reply in advance.
Yours Sincerely,
Shima.
yihui 2022-12-16 21:44:27For the first question, it is a hard LaTeX problem, and there is no general solution.
For the second question, for now you only have cache=TRUE; it is currently on my TODO list: yihui/knitr#396
Originally posted on 2013-06-04 19:22:30
Guest *astralth* @ 2013-06-07 09:18:55 originally posted:
Hi,
I found a minor glitch in the fig.scap option : is you enter captions with decimal numbers like ${0.12}$ without specifying the fig.scap option, you get an error because the subcaption is ${0 . Specifying the scap solves the issue but I guess it should be automatic not to break the caption in math mode :)
Thanks again for the great work !
yihui 2022-12-16 21:44:28That will be too much work for me, and is exactly what fig.scap is for. Thanks!
Originally posted on 2013-06-08 20:32:28
Guest *Peng Zhang* @ 2013-07-17 02:19:27 originally posted:
Hi Yihui,
Is that possible to put "opts_chunk$set(message = FALSE)" into some config files (like .Rprofile) so one doesn't have to put it into every single Rnw file? Thanks!
Peng
yihui 2022-12-16 21:44:29Yes you can do that.
library(knitr)
opts_chunk$set(message = FALSE)
The problem is you will load knitr for all R sessions, and that will slow R down by about 0.3 seconds.
Originally posted on 2013-07-18 18:05:17
Guest *Brandon* @ 2013-07-28 18:37:22 originally posted:
I'm using the setspace package with doublespacing in RStudio/knitr. However, I would not like the R output to be affected by this change in spacing. Is this possible?
yihui 2022-12-16 21:44:30I think you can redefine the knitrout environment, which is empty by default and your use case is exactly why it was created.
Originally posted on 2013-07-31 20:30:07
If you want to hide everything, use include=FALSE; if you want to hide the messages, use message=FALSE. See http://yihui.name/knitr/demo/output/
Originally posted on 2012-05-26 05:55:38
Please read the documentation ?print.xtable carefully. There are no arguments named tabular.environments. I can only see tabular.environment, and I do not see it can take a vector of length 2 in its documentation.
The only relevant piece for knitr is you need to set the chunk option results='asis' for that chunk.
Originally posted on 2012-06-19 14:39:27
Guest *yesraj* @ 2015-03-10 23:39:11 originally posted:
how to align the output to the left using knit options
giscus-bot 2022-12-19 06:23:47Guest *Guilherme Parreira* @ 2015-10-14 17:23:08 originally posted:
kable(..., align="l")
Guest *dhduncan* @ 2015-06-11 15:28:13 originally posted:
Yihui, thanks again for this page, I keep coming back.
I've just distributed an assignment to students in spanish using a knitted html doc, but when my colleague opens it the international characters aren't recognised. (ó, ñ, etc). The view settings in his browser look right (unicode) to me. I imagine there must be a way to encode instructions for the browser in the file itself, is there?
Guest *Guilherme Parreira* @ 2015-08-20 01:07:52 originally posted:
Hi Yihui!
How can I make the output from kable() to be like the first image?
When I use kable() I only get the second table.
I don't want this large space between columns...
(I realized that it has to deal with templates, but how can I control it?)
Guest *Hao Zhu* @ 2015-09-04 20:23:26 originally posted:
@disqus_JgnwJRdXiJ:disqus You can try the vignette template.
giscus-bot 2022-12-19 06:23:45Guest *Guilherme Parreira* @ 2015-10-07 19:27:07 originally posted:
thanks for replying me Hao Zhu! I tried it already, but I did not like the way the graphics are shown in the HTML output. Therefore, I want to keep with my template and the appearance of the tables like the tables from vignette
giscus-bot 2022-12-19 06:23:46Guest *Hao Zhu* @ 2015-10-07 19:35:52 originally posted:
What about the htmlTable package? It will by-pass the style-sheet but the bad thing is that you can no long control it. You can find a tutorial here https://cran.r-project.org/web/packages/htmlTable/vignettes/tables.html
Also, if you may want to check out the table.attr option in kable if you know css. I think you can define the style here. I'm not sure if it works but that's how I used it in shiny. Below is just an example of how to use table.attr. You cannot get the table you wanted from these code.
kable(table.foo,
format = "html", output = F, align = c("l", "c", "c", "c"), escape=F,
table.attr="class='table table-striped table-hover'")
giscus-bot 2022-12-19 06:23:47Guest *Guilherme Parreira* @ 2015-10-14 17:22:46 originally posted:
Tks Hao Zhu!
I tried the htmlTable function and it worked greatly!!! :D (I still don't know how to control it, but at least I god a nice table now!! :D)
thanks very much!!!
访客 *peter* @ 2015-10-14 06:11:41 写道:
目前knitr除了R之外,只支持python和awk,希望下一步能支持scheme.
giscus-bot 2022-12-19 06:24:01访客 *Martin Shi* @ 2020-03-23 13:53:38 写道:
其实支持很多语言了 包括go和nodejs
详见这里:https://bookdown.org/yihui/rmarkdown/language-engines.html
我最近加入了rust支持:yihui/knitr#1823
访客 *🐉®γσ ξηg* @ 2016-01-08 21:03:12 写道:
感谢分享哦,俺差不多每天都得与RMarkdown打交道,呵呵~
Guest *Paulo Mah* @ 2016-03-24 23:42:07 originally posted:
Hello,
Please, I am a beginner using knitr. I am using RStudio and Texnichcenter and trying to format a plot (graphic) in my latex document. The figure only appears at the top of the page. I have already change some chunk options, but they didn't work.
My global chunk is
<<setup, include="FALSE">>=
opts_chunk$set(dev="pdf", fig.path = "graphics/plot",
fig.lp = "",
out.width=".05textwidth",
fig.pos="b",
fig.keep="high",
fig.show="hold",
fig.align="center",
comment=NA)
knit_hooks$set(inline = function(x) {
if (is.numeric(x)) return(knitr:::format_sci(x, 'latex'))
x = as.character(x)
h = knitr:::hilight_source(x, 'latex', list(prompt=FALSE, size='normalsize', highlight=FALSE))
h = gsub("([_#$%&])", "1", h)
h = gsub('(["'])', '1{}', h)
gsub('^begin{alltt}s*|end{alltt}s*$', '', h)})
par(las = 1)
options(width = 30, scipen = 4, digits = 3)
@
So as to test, a specific chunk in my document would be:
<<model, echo="FALSE," fig.pos="b">>=
x1=c(1:10)
plot(x1, type="p")
@
Please, Does someone have any tip for me?
Thanks!!
Guest *Mason Garrison* @ 2016-03-25 18:06:59 originally posted:
You have a typo:
knit_patternss$get('document.begin') should read
knit_patterns$get('document.begin')
yihui 2022-12-19 06:23:48Thanks! Next time you can try to edit the Markdown file in the Github repo: https://github.com/yihui/knitr/tree/gh-pages (cf http://yihui.name/en/2013/06/fix-typo-in-documentation/ )
Originally posted on 2016-03-28 04:51:22
Guest *herz* @ 2016-04-30 01:22:50 originally posted:
I have put the following (and various variations of it where I load tidyr and/or formatR; try cache=FALSE, etc) in my first chunk.
library(knitr)
opts_chunk$set(tidy.opts=list(width.cutoff=60))
Yet it does not wrap code/comments in the rest of the document! I'm wondering if the version of RStudio, Rmarkdown, or of the packages it relies on matters (I have 0.99.484, rmarkdown - I deleted markdown, formatR is v1.3, knitr v1.12.3 I am able to fix by adding to the beginning of chunks as you suggested. However, I have a very large document that needs fixing so fixing this would be wonderful. Any other ideas? Thanks!
I can say that adding: ```{r, tidy=TRUE, tidy.opts=list(width.cutoff=60)} to the top of each chunk in the file works, but that will not help with my long document.
Guest *Aleza Wallace* @ 2016-05-09 23:37:04 originally posted:
is there a way to slide numbers to my beamer output
Guest *Joseph Powers* @ 2016-06-15 18:24:28 originally posted:
I am trying to control the size of pdf figures when knitting word documents from R Markdown, but the figures ouput as the same size in my word output (2" x 2") regardless of the fig.width and fig.height settings I write in the chunk options. All that fig.width and fig.height are changing is the proportions within the 2" x 2" figure output.
All help is greatly appreciated.
title: "Controlling PDF figure size in MS Word output"
output: word_document
knitr::opts_chunk$set(fig.path='02_Figs/', [fig.show](http://fig.show)='asis', dev = 'pdf',
include=FALSE, warning=FALSE, message=FALSE)
Fig. 1. Small Plot
with(mtcars, plot(mpg~wt))
Fig. 2. Big Plot
with(mtcars, plot(mpg~wt))
Guest *Shilpa Deshmukh* @ 2017-01-12 05:35:35 originally posted:
What should I do if I want to halt the execution of running code chunk in Rstudio (.Rmd file)?
Guest *George* @ 2017-04-26 22:28:09 originally posted:
Thank you for your work. This is very helpful.
I am wondering how I can suppress "intermediate" plots. The code below generate a histogram although the 'hist' command is only used to get counts from hist(). Thanks in advance for any idea.
George
See the code below:
min_ct<-min(hist(myfdata[myfdata$slope>low, ]$dy, breaks = bi)$counts)
giscus-bot 2022-12-19 06:23:50Guest *Leonardo Fontenelle* @ 2017-09-15 21:41:42 originally posted:
See ?hist
Guest *Juan* @ 2017-05-31 18:25:06 originally posted:
Yihui It is possible to write an article in the Spanish language with R markdown. Example "Table = Tabla", "Figure = Figura", ....
Gracias.
giscus-bot 2022-12-19 06:23:55Guest *Antonio* @ 2018-02-12 08:53:15 originally posted:
Claro que lo es. Usando latex. Tienes que añadir el uso del paquete babel en el yaml, quedando algo así:
title: "Title"
author: "Me"
header-includes:
- usepackage[spanish]{babel}
output:
pdf_document
giscus-bot 2022-12-19 06:24:00Guest *Pedro Torres* @ 2020-02-06 00:58:17 originally posted:
También puedes usar la función lang: es:
title: "Title"
author: "Me"
lang: es
output:
pdf_document
Guest *Marius Bottin* @ 2017-06-05 14:42:34 originally posted:
I am wandering whether there is a simple way to automatically insert the name of the engine (R, python, bash,sql) as a title of the chunk in the final document (html and pdf through pdflatex).
It is because I am writing documents using different engines, and it is sometimes confusing for my readers...
I imagine it is possible through css classes for html, but since I like to make output document in both pdf and html...
Guest *fboehm* @ 2017-11-08 21:07:54 originally posted:
Is it possible to create a html file in which the user can "expand" or "collapse" an R code chunk to view (or not view) the code in the chunk?
giscus-bot 2022-12-19 06:23:51Guest *fboehm* @ 2017-11-08 21:12:50 originally posted:
I think that code folding is what I want.
http://rmarkdown.rstudio.com/html_document_format.html#code_folding
Guest *Henrik* @ 2017-12-14 18:49:52 originally posted:
is it possible to create a new empty python chunk (in rmarkdown in Rstudio) using a short cut like we can do to create a new r code chunk?
yihui 2022-12-19 06:23:52No short cut but you can use the dropdown menu "Insert" from the RStudio toolbar.
Originally posted on 2017-12-14 23:07:08
Guest *Henrik* @ 2017-12-19 08:58:40 originally posted:
Yihui, I love how I can work with Rmarkdown and knitr in Rstudio.
On the other hand, I love writing in my favorite text editor Atom.
I can execute both R and Python code chunks in Atom but the Python implementation is better in Atom (with packages) because e.g. the variables are not lost as in RStudio between code chunks. Also, I just like writing in Atom more.
But the problem is that I cannot convert e.g. the final .md file that contains markdown and R&Python chunks into such a nice looking output as Rstudio can do with rmarkdown.
Is there a way to basically use rmarkdown/knitr in Atom and especially in such a way that I can run Python code chunks just like I use R code chunks? Currently I can run Python but not between code cells...
yihui 2022-12-19 06:23:53You need to wait for the next version of knitr, or the current devel version, to be able to run Python code across chunks in the same Python session: yihui/knitr#1440
Originally posted on 2017-12-19 20:12:50
giscus-bot 2022-12-19 06:23:53Guest *Henrik* @ 2017-12-19 20:23:22 originally posted:
your work is awesome!
yihui 2022-12-19 06:23:54Please just update knitr to 1.18 and install the reticulate package in R.
Originally posted on 2017-12-28 15:02:48
giscus-bot 2022-12-19 06:23:57Guest *Salerno* @ 2018-12-21 17:28:34 originally posted:
Hi Henrik!
Like you, you are going through a path that I would like follow, I mean, using Atom, Python and R. Could you share with me some main topics about it?
Best,
giscus-bot 2022-12-19 06:23:58Guest *Henrik* @ 2018-12-21 18:03:45 originally posted:
Hi Andre,
I can recommend two ways:
-
By now using RStudio with Python works better than back when I asked that question. I can recommend to work in Rstudio.
-
Install Anaconda with newest Python, install R and IRKernel. Then you can work in Jupyter and launch either R or Python notebooks. Working with R in Python notebooks also works nice with the magic commands like %%R
-
In Atom: First do step 2, then install Hydrogen in Atom and the language files for Atom.
I use mostly 2 and 3 because I just have found my workflow. But I would recommmend RStudio to everyone because it is simpler and straightforward. But if you like me like more writing cose in a texteditor without any distraction then hydrogen for Atom is perfect.
giscus-bot 2022-12-19 06:23:58Guest *Salerno* @ 2018-12-23 09:52:28 originally posted:
Very good tips! I will do some of them, specially that one I should use Anaconda.
Tks!
访客 *Shixiang Wang* @ 2018-02-12 07:53:19 写道:
Yihui,我有一个问题,怎么样可以在knit输出md文档时,自定义图片的名称和路径。 比如 我怎么在rmd文档设定方括号内和圆括号内的内容呢?
我使用hexo写博客有点小忧伤,它识别图片既不是机器的相对路径,也不是绝对路径;而是根据它自己内在设定的目录层级识别的。所以我希望能在rmd文档自定义knit导出后的效果。
Guest *Matthias* @ 2018-02-23 15:46:40 originally posted:
Dear Yihui,
Great work!
I am using knitr in combination with Rnw. Is there a possibility to highlight only certain elements of syntax and/or to change the color of certain elements of syntax highlighting.
Thanks a lot!
Guest *Esteban Cervetto* @ 2018-02-23 18:01:28 originally posted:
cómo hago funcionar un prompt interactivo dentro de un chunk
promptGuardar <- menu (c ("Si", "No"), title="¿Actualizar caché de tablas?")
if (promptGuardar == 1) {
save.image()
}
me sale
Error in menu(c("Si", "No"), title = "¿Actualizar caché de tablas?") :
menu() cannot be used non-interactively
Calls: ... withCallingHandlers -> withVisible -> eval -> eval -> menu
Ejecución interrumpida
giscus-bot 2022-12-19 06:23:56Guest *Andres Aravena* @ 2018-10-03 08:16:27 originally posted:
No creo que nadie responda a preguntas en castellano. Tendrás más éxito con Inglés.
Creo que lo que tu preguntas no se puede hacer. Knitr es para hacer documentos, como un PDF, que se imprime y no cambia.
Quizá puedes tener algo como lo que buscas usando Shiny
Guest *Jan Spörer* @ 2018-06-03 16:45:29 originally posted:
Is it possible to fit the size of a plot to the size of a beamer slide?
Guest *George Flynn* @ 2018-08-18 08:01:12 originally posted:
Yihui - hello - I am new to knitr and am trying to create a PDF document for an assignment, I am getting the following error:
processing file: Cars.Rmd
|...... | 9%
ordinary text without R code
|............ | 18%
label: setup (with options)
List of 1
$ include: logi FALSE
|.................. | 27%
ordinary text without R code
|........................ | 36%
Quitting from lines 25-32 (Cars.Rmd)
Error in eval(x, envir = envir) : object 'False' not found
Calls: ... process_group.block -> call_block -> eval_lang -> eval -> eval
Execution halted
Lines 25 -32 are:
library(knitr)
library(ggcorrplot)
library(ggplot2)
data(mtcars)

corr <- round(cor(mtcars), 2)
ggcorrplot(corr, hc.order = TRUE, type = "lower",lab = TRUE)
I am assuming it has something to do with the chunk options?
Thanks George
Guest *Matthias* @ 2019-03-23 15:43:16 originally posted:
Yihui, great work - I love to use knit, actually with .Rnw to write a textbook.
One question: Is there a way to remove the empty line between the function call and the respective output of the function?
Thanks a lot for your support!
Guest *Pedro Torres* @ 2020-02-06 01:01:10 originally posted:
Whenever i print a large vector or a frame, i always get part of my R output out of the margins... ¿Is it possible to adjust the output margins?
Guest *Jon Wakefield* @ 2020-07-06 22:14:51 originally posted:
I use beamer slides extensively, as created by Rmarkdown, and always have problems with R output being too wide.
Can you help me with the following simplified file:
---
title: "Test File"
author: |
| Jon
| University of Washington
date: "`r Sys.Date()`"
output:
beamer_presentation:
theme: "AnnArbor"
colortheme: "dolphin"
keep_tex: yes
slidy_presentation: default
---

```{r setup, echo=FALSE, message=FALSE, warning=FALSE}
library(knitr)
opts_chunk$set(collapse=TRUE, fig.align='center', tidy=TRUE, tidy.opts=list(blank=TRUE, width.cutoff=20,strip.white=TRUE), warning=FALSE,message=FALSE,cache=TRUE)
```
## test

```{r, message=FALSE, collapse=TRUE, tidy=TRUE,tidy.opts=list(width.cutoff=30)}
seq(1,100)
```
Guest *ERWIN LARES* @ 2021-02-20 19:30:43 originally posted:
Hello Smart People!
Here with a question about cross-referencing. I am successfully using @ref(tab:my-table) and @ref(fig:my-figure) to cross reference tables and figures that I created inside R chunks. Yay for me.
Then I started writing numbered linguistics examples with code like this:
begin{exe}
exlabel{stm-01}
hfil
begin{tikzpicture}[baseline=0pt]
Tree [.{textbf{Aspectual Classes}} [.textbf{Statives} textit{States} ][.textbf{Dynamic} [.textbf{Atelic} textit{Activities} ][.textbf{Telic} [.textbf{Instantaneous} textit{Achievements} ][.textbf{Durative} textit{Accomplishments} ]]]]
end{tikzpicture}
hfil
medskip
end{exe}
When I was trying to cross reference my example I was stuck. I trying adding a name to the chunk and captioning the chunk, but no avail. Then by chance I wrote this ref{stm-01} and it work like a charm.
So my question is, what is the difference between @ref(tab:my-table) and ref{my-label}
Much appreciative!
Guest *Ale Campoy* @ 2021-03-07 00:51:18 originally posted:
Why is this happening? I cannot find the proper argument. My Rmd is:
title: |
| Title
output:
pdf_document: default
html_document: default
always_allow_html: 'true'
knitr::opts_chunk$set(fig.pos = 'H' )
knitr::opts_chunk$set(echo = TRUE)
Paquetes que vamos a usar en alguno de los ejercicios:
library(rio)
library(rknn)
library(kknn)
0. Análisis exploratorio y transformación de los datos
Primero cargamos el archivo con los datos
setwd("P:/MDS/AEM/Entrega 2") # Mi Working directory, cambiar para que funcione
dataset_raw <- import("khantrainadd.csv")
dataset_raw$V1 <- NULL # esta columna con el indice no nos interesa
head(dataset_raw)[,1:5]
table(dataset_raw$class) # Mi variable objetivo
dim(dataset_raw)
and I get inverted order of the chunks, no matter what I do the following pdf knit https://uploads.disquscdn.com/images/e716a777b15a9bbe91aea5ebb629b1f485af61922031eeaffb6eea31453ecc8b.png
Guest *Ming* @ 2021-04-11 12:33:57 originally posted:
Hi Yihui, in R notebook inline display, the real plot size in the chunk display is consistently about 2.5-3 times larger than the specified fig.width and fig.height in the chunk options. Any comments on what might be causing this issue? Plus, the font size in the chunk display is about 50% larger than the specified font size, when compared with ggsave output. I have tried updating my Rstudio, R, didn't change anything. I also tried to use external monitors, same behavior. I use R notebook as a workhorse and having the right size plot in the chunk display is really important to me. Any insight would be appreciated!
yihui 2022-12-19 06:24:02That sounds like an RStudio issue, which is beyond my expertise. Please consider asking the question on RStudio Community or file an issue to the Github repo rstudio/rstudio. Thanks!
Originally posted on 2021-04-12 13:39:30
Guest *rt* @ 2021-11-08 06:12:46 originally posted:
~ code chunks are related to links on a page while r relates to data packages
yihui 2022-12-19 06:24:04Sorry, I didn't get it. What do you mean?
Originally posted on 2021-11-12 05:46:53
Guest *Mike Gilchrist* @ 2021-11-10 05:29:16 originally posted:
I'm using knitr with emacs and ESS. My console output is getting truncated with with the text "[TRUNCATED]". I believe this is the result of knitr. Is there a setting I can change to remove this?
yihui 2022-12-19 06:24:03This is not caused by knitr; knitr doesn't have control over the R console.
Originally posted on 2021-11-10 14:25:09
giscus-bot 2022-12-19 06:26:06Guest *Mike* @ 2021-11-13 13:47:46 originally posted:
Okay. Thanks for clearing that up.
Guest *peacecop kalmer:* @ 2022-05-11 18:29:04 originally posted:
How can i include LaTeX-package declarations for HTML output? For instance, if i choose PDF as output format, i can write "usepackage{...}" into a separate TEX-file that i reference in RMD-file by "template: ...". However, if i don't use a separate TEX-file and only want HTML-output then the built-in LaTeX-packages work fine and i can use equations using them but if i want to use a non-buil-in-package then what should i do? There are so many examples out there for primitive things but once it gets complicated i seldom find a solution.
Guest *MrDJR* @ 2017-04-25 14:33:21 originally posted:
Sorry for the poor formatting. I can't seem to preview, edit, or delete. I'll try once more with escape characters:
Hi! I'm trying to append a custom class to a figure div by supplying class.output='myClass' to my chunk options as follows:
plot(1:10)
I expect the page element to be <div class="figure myClass" ="">; but instead it remains <div class="figure" ="">. I'm rendering the page with bookdown::html_document2. What am I doing wrong?

FYI: in
size: ('normalsize'; character) Font size of the chunk output from .Rnw documents. See this page for possible sizes.
The URL link is broken. Perhaps this is temporary(?), in the meantime, here is another page covering the topic: https://latex-tutorial.com/changing-font-size/
👍 1
yihui 2023-03-08 14:45:29Thanks for the reminder! I can access the link right now. Perhaps it was a temporary problem.

Hello yihui
I am rendering a pdf document from within Shiny app and at one instance I need to include a png plot previously saved. The Rmd file is placed in the root directory of the shiny app along with global.R, server.R and ui.R. Function includegraphics() works fine if I use it inline but not so inside code chunk:
Inline, but with no caption (caption throws a "float" error in this case):
knitr::include_graphics('./src/coverage001.png', dpi = 72, auto_pdf = TRUE)Inside code chunk preferably with caption:
```{r covPlot, fig.align='center',  fig.ncol = 1, fig.sep = '\\par', fig.width = 9, fig.show = 'asis', fig.keep = 'all', fig.cap = sprintf('Protein %s: Coverage', names(chain))}
# coverage plot
knitr::include_graphics('./src/coverage001.png', dpi = 72, auto_pdf = TRUE)
```
When I run the chunk in RStudio, the figure appears under the chunk but not so inside the rendered document. No latex error either in the log file. I am using graphicx package without any success and all R packages are at their latest version. I have also `tlmgr_reinstalled tinytex and updated, to no avail. Please advise, thank you!
yihui 2023-05-19 01:40:51the figure appears under the chunk but not so inside the rendered document
I'm not sure what that means. Do you know that figure environments in LaTeX float by default? That is, usually they don't appear exactly where you place them in the source document. Reference: https://bookdown.org/yihui/rmarkdown-cookbook/figure-placement.html
@yihui Thank you for the prompt reply!
Is not about where the figure appears in the pdf document. My question was referring to why the figure only appears in the pdf document when include_graphics is used inline and why it does not appear at all in the pdf document when include graphics is used inside the code chunk.
In other words, what should I add to the chunk options to have the figure appear when I use include_graphics inside the code chunk (please see chunk options in example 2).
This is what I mean by inline (example 1):
`r knitr::include_graphics('./src/coverage001.png', dpi = 72, auto_pdf = TRUE)`
and this is what I mean by code chunk (example 2):
```{r  fig.align='center',  fig.ncol = 1, fig.sep = '\\par', fig.width = 9, fig.show = 'asis', fig.keep = 'all', fig.cap = "A00B10"}
knitr::include_graphics('./src/coverage001.png', dpi = 72, auto_pdf = TRUE)
```
This is part of my document header, including latex packages (the indents are stripped by the browser - they are correct in the Rmd):
output:
  pdf_document:
    latex_engine: xelatex
    df_print: paged
    fig_caption: yes
    toc: yes
    extra_dependencies: float
    highlight: tango
lof: yes
lot: yes
fontawesome: yes
fig.align: center
graphics: yes
header-includes:
 \usepackage{fontspec} \usepackage{graphicx} \usepackage{pdflscape} \usepackage{rotating} \usepackage{titling} \setlength{\droptitle}{-1cm} \usepackage{float} \let\origfigure\figure \let\endorigfigure\endfigure \renewenvironment{figure}[1][2] {\expandafter\origfigure\expandafter[H]} {\endorigfigure} \usepackage{mdframed} \usepackage{subfig} \usepackage{fancyhdr} \setlength{\headheight}{42.45442pt} \addtolength{\topmargin}{-1.3pt} \usepackage{graphicx} \usepackage{booktabs,xcolor} \usepackage{lastpage} \usepackage{longtable} \pagestyle{fancy} \fancyhf{} \fancyfoot[R]{\thepage} \setlength\footskip{14.5pt} \fancypagestyle{plain}{\pagestyle{fancy}} \lhead{\today}  \rhead{\includegraphics[width=2.5cm]{./www/logo.png}}
mainfont: Palatino Linotype
geometry: margin = 0.75in
fontsize: 11pt
Regarding latex packages: where can I find some succinct information on what latex package(s) to call with \use{} for various tasks?
Thank you!
yihui 2023-05-19 03:41:16My question was referring to why the figure only appears in the pdf document when
include_graphicsis used inline and why it does not appear at all in the pdf document wheninclude graphicsis used inside the code chunk.
I see. That's odd. Sorry I have no idea... A minimal reproducible example will be helpful.

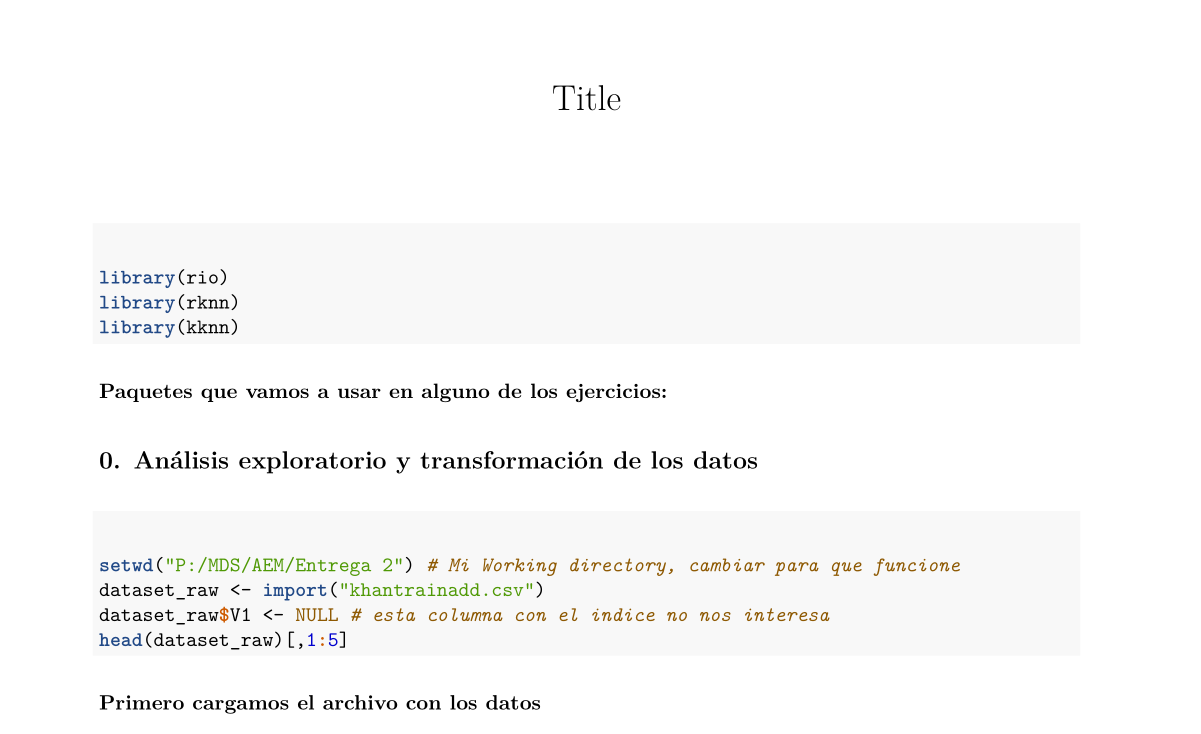
I had a render pdf problem when my images had multiple dots in the filename, knitr.include.graphics.ext not run?
Sign in to join the discussion
Sign in with GitHub